OVERALL SUMMARY
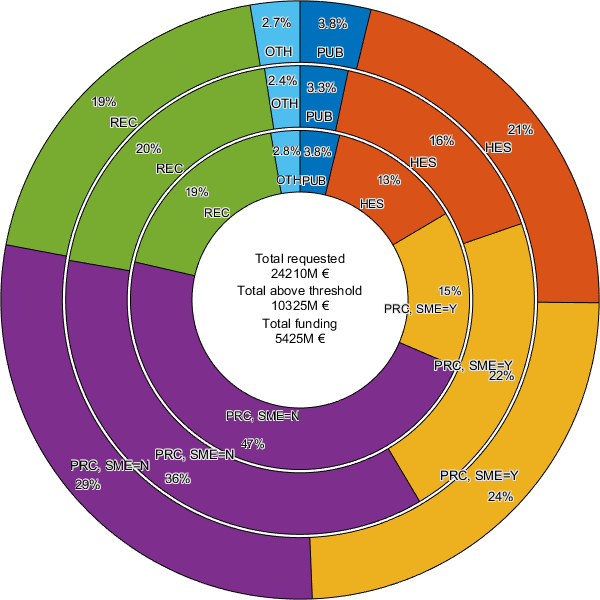
EU Contribution by Organization Type
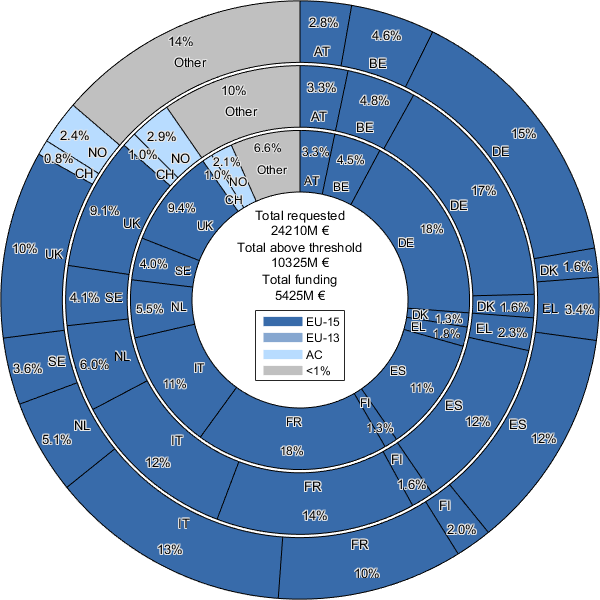
EU Contribution by Country
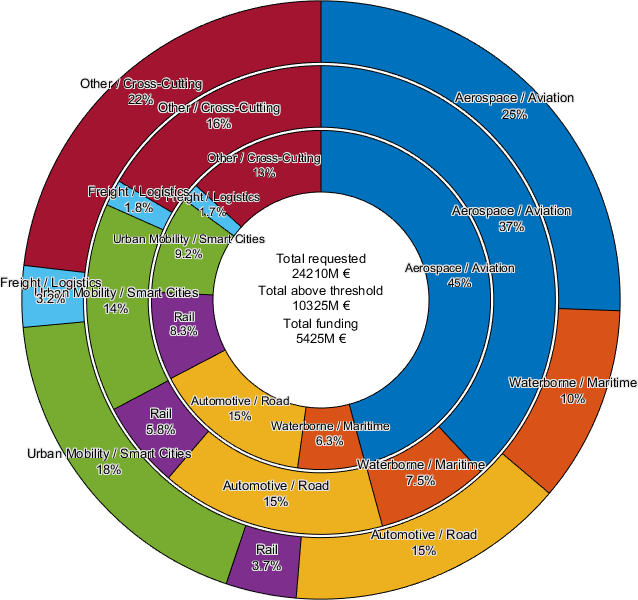
| Aerospace / Aviation | Waterborne / Maritime | Automotive / Road | Rail | Urban Mobility / Smart Cities | Freight / Logistics | Other / Cross-Cutting | Overall | |
|---|---|---|---|---|---|---|---|---|
| # submitted proposals | 3047 | 361 | 578 | 274 | 2935 | 141 | 2775 | 10311 |
| # funded projects | 784 | 46 | 113 | 107 | 328 | 14 | 332 | 1748 |
| Sucess rate # proposals | 25.7% | 12.7% | 19.6% | 39.1% | 11.2% | 9.9% | 12.0% | 17.0% |
| # participations in submitted proposals | 13569 | 3862 | 5805 | 2403 | 8054 | 2070 | 11432 | 48641 |
| # participations in funded projects | 5442 | 860 | 1845 | 1634 | 1490 | 368 | 2317 | 14215 |
| Sucess rate # participations | 40.1% | 22.3% | 31.8% | 68.0% | 18.5% | 17.8% | 20.3% | 29.2% |
| Total Grant proposed, million EUR | 6062.1 | 2480.2 | 3535.2 | 889.9 | 4298.7 | 774.1 | 5400.5 | 24263.3 |
| Total Grant supplied, million EUR | 2442.7 | 341.9 | 806.4 | 448.6 | 498.4 | 91.1 | 703.8 | 5426.1 |
| Sucess rate moneywise | 40.3% | 13.8% | 22.8% | 50.4% | 11.6% | 11.8% | 13.0% | 22.4% |
| EU contribution, million EUR | # Projects | # Participations | # Coordinations | ||||||||||
|---|---|---|---|---|---|---|---|---|---|---|---|---|---|
| Country | Country Code | Proposed | Funded | Success Rate | Proposed | Funded | Success Rate | Proposed | Funded | Success Rate | Proposed | Funded | Success Rate |
| Albania | AL | 2.1 | 0.0 | 1.4% | 11 | 1 | 9.1% | 21 | 1 | 4.8% | 3 | 0 | 0.0% |
| Armenia | AM | 0.1 | 0.0 | 0.0% | 1 | 0 | 0.0% | 2 | 0 | 0.0% | 0 | 0 | 0.0% |
| Austria | AT | 669.0 | 178.7 | 26.7% | 956 | 297 | 31.1% | 1495 | 588 | 39.3% | 257 | 66 | 25.7% |
| Bosnia and Herzegovina | BA | 0.9 | 0.0 | 4.1% | 10 | 1 | 10.0% | 10 | 1 | 10.0% | 6 | 0 | 0.0% |
| Belgium | BE | 1101.8 | 244.4 | 22.2% | 1681 | 484 | 28.8% | 2787 | 899 | 32.3% | 391 | 116 | 29.7% |
| Bulgaria | BG | 64.7 | 3.0 | 4.6% | 169 | 25 | 14.8% | 230 | 27 | 11.7% | 81 | 1 | 1.2% |
| Switzerland | CH | 199.4 | 54.3 | 27.2% | 526 | 183 | 34.8% | 670 | 242 | 36.1% | 68 | 17 | 25.0% |
| Cyprus | CY | 127.9 | 15.7 | 12.3% | 185 | 32 | 17.3% | 277 | 49 | 17.7% | 32 | 2 | 6.3% |
| Czechia | CZ | 243.2 | 52.4 | 21.6% | 493 | 161 | 32.7% | 628 | 220 | 35.0% | 95 | 13 | 13.7% |
| Germany | DE | 3607.9 | 998.7 | 27.7% | 3034 | 750 | 24.7% | 6026 | 2041 | 33.9% | 1078 | 208 | 19.3% |
| Denmark | DK | 379.6 | 73.1 | 19.3% | 449 | 131 | 29.2% | 615 | 178 | 28.9% | 143 | 29 | 20.3% |
| Estonia | EE | 84.5 | 6.4 | 7.5% | 176 | 18 | 10.2% | 219 | 25 | 11.4% | 60 | 5 | 8.3% |
| Greece | EL | 817.3 | 99.6 | 12.2% | 1034 | 184 | 17.8% | 1872 | 341 | 18.2% | 279 | 27 | 9.7% |
| Spain | ES | 2905.0 | 594.9 | 20.5% | 3143 | 699 | 22.2% | 5961 | 1646 | 27.6% | 1708 | 333 | 19.5% |
| Finland | FI | 477.7 | 68.8 | 14.4% | 514 | 113 | 22.0% | 733 | 172 | 23.5% | 219 | 29 | 13.2% |
| Faroe Islands | FO | 0.2 | 0.3 | 136.1% | 6 | 2 | 33.3% | 6 | 2 | 33.3% | 4 | 1 | 25.0% |
| France | FR | 2427.2 | 996.3 | 41.0% | 2305 | 654 | 28.4% | 4442 | 1837 | 41.4% | 844 | 195 | 23.1% |
| Georgia | GE | 0.1 | 0.0 | 0.0% | 5 | 0 | 0.0% | 5 | 0 | 0.0% | 2 | 0 | 0.0% |
| Croatia | HR | 106.9 | 6.1 | 5.7% | 240 | 59 | 24.6% | 327 | 69 | 21.1% | 62 | 4 | 6.5% |
| Hungary | HU | 198.7 | 19.6 | 9.9% | 419 | 100 | 23.9% | 509 | 119 | 23.4% | 171 | 15 | 8.8% |
| Ireland | IE | 219.7 | 30.3 | 13.8% | 357 | 97 | 27.2% | 501 | 136 | 27.1% | 89 | 12 | 13.5% |
| Israel | IL | 257.2 | 22.6 | 8.8% | 332 | 43 | 13.0% | 397 | 55 | 13.9% | 138 | 13 | 9.4% |
| Iceland | IS | 23.3 | 1.4 | 6.1% | 52 | 12 | 23.1% | 73 | 13 | 17.8% | 28 | 5 | 17.9% |
| Italy | IT | 3163.7 | 618.7 | 19.6% | 3190 | 667 | 20.9% | 6191 | 1597 | 25.8% | 1598 | 228 | 14.3% |
| Lithuania | LT | 58.1 | 6.7 | 11.5% | 171 | 51 | 29.8% | 215 | 63 | 29.3% | 36 | 4 | 11.1% |
| Luxembourg | LU | 45.9 | 12.6 | 27.5% | 137 | 31 | 22.6% | 164 | 39 | 23.8% | 14 | 4 | 28.6% |
| Latvia | LV | 57.7 | 3.4 | 5.9% | 128 | 20 | 15.6% | 151 | 22 | 14.6% | 50 | 3 | 6.0% |
| Moldova | MD | 0.2 | 0.0 | 0.0% | 2 | 0 | 0.0% | 2 | 0 | 0.0% | 0 | 0 | 0.0% |
| Montenegro | ME | 0.6 | 0.1 | 11.2% | 7 | 1 | 14.3% | 8 | 1 | 12.5% | 1 | 0 | 0.0% |
| Macedonia | MK | 4.2 | 0.1 | 2.8% | 20 | 2 | 10.0% | 22 | 2 | 9.1% | 0 | 0 | 0.0% |
| Malta | MT | 39.4 | 2.8 | 7.1% | 79 | 10 | 12.7% | 90 | 13 | 14.4% | 14 | 0 | 0.0% |
| Netherlands | NL | 1237.9 | 298.3 | 24.1% | 1532 | 431 | 28.1% | 2575 | 815 | 31.7% | 396 | 81 | 20.5% |
| Norway | NO | 572.9 | 111.9 | 19.5% | 580 | 149 | 25.7% | 943 | 265 | 28.1% | 189 | 25 | 13.2% |
| Poland | PL | 393.8 | 35.0 | 8.9% | 700 | 144 | 20.6% | 998 | 221 | 22.1% | 251 | 16 | 6.4% |
| Portugal | PT | 518.6 | 42.5 | 8.2% | 663 | 122 | 18.4% | 1011 | 200 | 19.8% | 212 | 21 | 9.9% |
| Romania | RO | 183.6 | 22.8 | 12.4% | 357 | 76 | 21.3% | 503 | 108 | 21.5% | 90 | 5 | 5.6% |
| Serbia | RS | 27.9 | 4.0 | 14.2% | 121 | 27 | 22.3% | 143 | 29 | 20.3% | 19 | 2 | 10.5% |
| Sweden | SE | 878.2 | 218.8 | 24.9% | 1071 | 299 | 27.9% | 1608 | 576 | 35.8% | 308 | 49 | 15.9% |
| Slovenia | SI | 233.3 | 27.5 | 11.8% | 386 | 73 | 18.9% | 545 | 100 | 18.3% | 139 | 15 | 10.8% |
| Slovakia | SK | 113.8 | 6.1 | 5.3% | 206 | 61 | 29.6% | 249 | 78 | 31.3% | 51 | 1 | 2.0% |
| Tunisia | TN | 11.9 | 0.0 | 0.0% | 6 | 0 | 0.0% | 17 | 0 | 0.0% | 2 | 0 | 0.0% |
| Turkey | TR | 218.6 | 27.0 | 12.4% | 350 | 61 | 17.4% | 507 | 82 | 16.2% | 125 | 8 | 6.4% |
| Ukraine | UA | 31.5 | 4.3 | 13.7% | 78 | 13 | 16.7% | 116 | 23 | 19.8% | 30 | 3 | 10.0% |
| United Kingdom | UK | 2453.5 | 507.4 | 20.7% | 2574 | 622 | 24.2% | 4118 | 1130 | 27.4% | 1017 | 190 | 18.7% |